


This article was originally published by WisdomTree on 28 Jul 2025. Written by Pierre Debru.
Key Takeaways
- Tariff truce, softer dollar and European Central Bank (ECB) rate cuts powered a broad Q2 rebound. Growth & Momentum out-paced all other factors, while High Dividend and Min-Vol lagged.
- Year-to-date, the leadership baton passed to Value and Size, particularly in Europe and Emerging Markets (EM), highlighting a cyclical rotation and the first meaningful small-cap revival in years, as Quality slipped to the bottom of the league table.
- Looking ahead, diverging central-bank paths will be decisive: a soft-landing backdrop could keep US Growth/Momentum strong while extending Europe & EM Value-Size strength, but a flare-up in tariffs or inflation would tilt demand toward defensive quality, yield and low-volatility factors.
Looking back to Q2 2025, Global equities powered through the second quarter of 2025, as a 90-day pause on fresh US “reciprocal tariffs” reignited risk appetite and helped the MSCI World return 11.5%. The MSCI USA returned an almost identical 11.2%, while Emerging Markets (EM) benefited strongly, at 12.0%. Europe, on the other hand, faltered after a strong start, with 2.5%. Q1’s rally left the year-to-date scorecard at 9.5% for World equities, 6.1% for the USA, 8.5% for Europe, and 15.3% for EM.
The policy pause was reinforced by softer core inflation prints and a 10% slide in the dollar index, its steepest consecutive quarter drop in three decades. Meanwhile, the European Central Bank delivered 25 bp cuts in April and June, taking the deposit rate to 2%, while the US Federal Reserve (Fed) stayed on hold despite intensifying political calls for a 300 bp easing cycle.
From a factor perspective:
- Growth and Momentum led Q2 on AI-capex strength across Global and US equities. All other factors struggled in those regions.
- Value is 2025’s global winner (+7.2 % vs MSCI World) as cyclicals catch the dollar tailwind, whereas Quality is the laggard (-3.3 %vs MSCI World).
- Regional divergences: Europe’s unremarkable performance in Q2 hid a strong Size pulse; EM saw Value and Size surge on policy easing.
This instalment of the WisdomTree Quarterly Equity Factor Review examines how equity factors behaved during the second quarter and their potential impact on investors’ portfolios.
Quarterly performance in focus: tariffs, tech and a size revival
The tariff pauses and weaker dollar propelled equities higher, with mega-cap tech re-accelerating in the US and a rates-sensitive rebound in EM. Europe trailed as profit revisions lagged, and energy names underperformed despite the European Central Bank (ECB) easing.
On the factor front, Q2 showed a strong rotation from Value to Growth:
- Growth & Momentum thrive on AI earnings: blockbuster Q2 results from the “Magnificent 7” lifted Growth in the USA and globally; Momentum was the most consistent and added 3–5 % across regions.
- Risk-off factors retreat: the volatility fade and flatter yield curves hurt High Dividend and Min-Vol.
- Size comeback in Europe & EM: lower real yields and tariff optimism boosted European industrials and EM exporters, propelling Size.
- Value pockets of strength: Value beat in EM and Europe on better cyclicals, even though it lagged in the US amid tech dominance.
Figure 1: Equity factor outperformance in Q4 2024 across regions
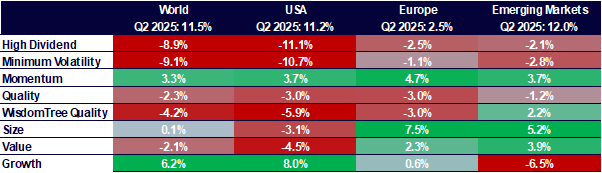
Source: WisdomTree, Bloomberg. 31 March 2024 to 30 June 2025. Calculated in US Dollars for all regions except Europe, where calculations are in EUR. Historical performance is not an indication of future performance and any investments may go down in Value.
H1 in review: Value ascendant, quality in retreat
Despite tariff scares, global equities have added 9.5 % YTD, helped by disinflation and early-cycle rate cuts outside the US The ECB’s cumulative 200 bp easing contrasts with a Fed on pause, widening rate differentials and supporting non-USD assets, leading to a strong 8.5% from the MSCI Europe and 15.3% from MSCI Emerging Markets year-to-date.
On the factor front, Value dominated in H1:
- Global Value leadership: cheaper cyclicals and financials rallied on higher nominal growth and a weaker dollar, lifting Value 6-7 % above benchmarks worldwide.
- Momentum still potent in the US & Europe: sustained earnings revisions kept Momentum atop regional tables even as Growth cooled in Q1.
- Quality under strain: rising duration risk premia and fading mega-cap safe-haven demand left Quality weakest everywhere outside of a more risk adverse period around February/March.
- Small Caps still split: Size enjoyed revival in Europe and EM but remains underwater in the US (-6.4 %) where policy uncertainty lingers.
Figure 2: Equity factor outperformance Year to Date across regions
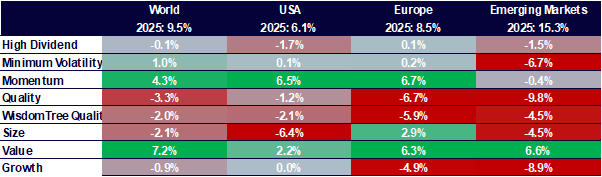
Source: WisdomTree, Bloomberg. 31 December 2024 to 30 June 2025. Calculated in US. Historical performance is not an indication of future performance and any investments may go down in Value.
Size strikes back: Are rate cuts lighting a small-cap revival?
After years in the wilderness, small and mid-caps are finally outperforming large caps in Europe and EM, helped by the ECB’s back-to-back 25 bp cuts in April and June and a softer US dollar backdrop. MSCI Europe Small Cap is up 11.7 % YTD versus 8.7% for MSCI Europe and only 0.4% for the Russell 2000. Overall, cheaper valuations and rising earnings beta to domestic demand are driving this potential Size revival.
In EM, policy easing and a semiconductor rebound in Korea/Taiwan have lifted MSCI EM Small Cap to +19% vs +13.8% for MSCI EM since the start of Q2.
Figure 3: Small Caps have dominated in the last three to four months in Europe and Emerging Markets
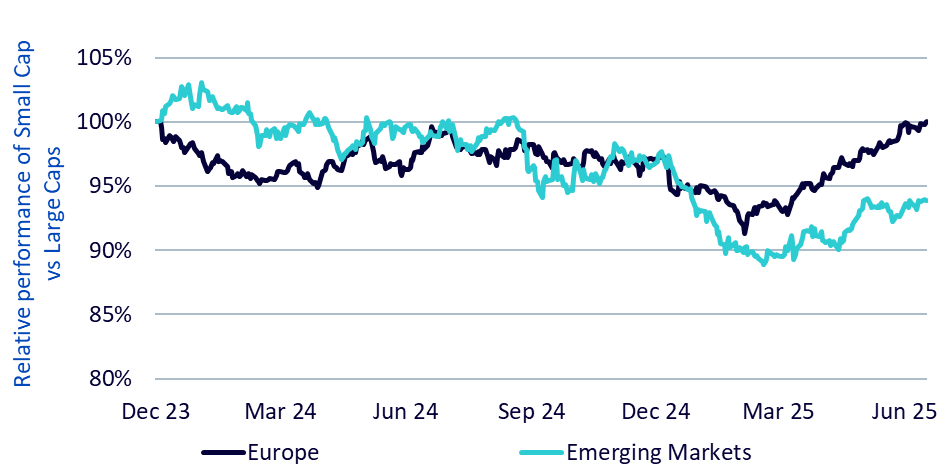
Source: WisdomTree, Bloomberg. 31 December 2023 to 15 July 2025. Calculated in USD for EM and EUR for Europe. The graph represents the performance differential (calculated as a ratio of the normalised performance of the two indices) between MSCI Europe Small Cap net and MSCI Europe net for one line and MSCI EM Small cap net and MSCI EM net for the other. Historical performance is not an indication of future performance and any investments may go down in Value.
Growth remains very expensive across the board
Valuation increased almost across the board in Q2 2025, with Growth, Size, and Quality experiencing mostly above-market rises, while the valuation of other factors suffered smaller increases. Momentum in Europe and Emerging Markets stands out as the exception to the rule with clear drops in valuation this quarter.
Figure 4: Historical Evolution of Price to Earnings ratios of equity factors
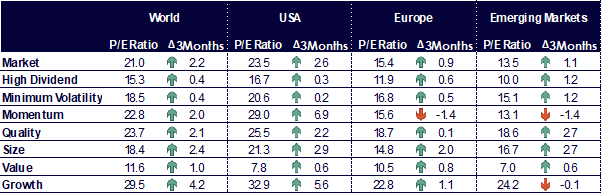
Source: WisdomTree, Bloomberg. As of 30 June 2025. Historical performance is not an indication of future performance and any investments may go down in Value.
Positioning for a Divergent Second Half
With US policy still data-dependent, the ECB mid-cycle in easing mode and several EM central banks already cutting, investors face an increasingly asynchronous macro map. A soft-landing scenario – gradual disinflation, modest growth and no new tariff escalation could:
- Sustain Growth & Momentum leadership in the US if AI capex and earnings beats persist.
- Extend the Value-Size catch-up in Europe and EM as cheaper cyclicals benefit from easier policy and a weaker dollar.
Conversely, a tariff relapse or sticky US inflation would argue for selective Quality, High Dividend and Min-Vol hedges.
Facing such a market, investors could look at a barbell between Quality Growth (for secular compounders) with Smaller Cap Value (for cyclical beta). Also, an overweight European Value and EM Momentum where monetary loosening is most advanced could be helpful as well.
World is proxied by MSCI World net TR Index. US is proxied by MSCI USA net TR Index. Europe is proxied by MSCI Europe net TR Index. Emerging Markets is proxied by MSCI Emerging Markets net TR Index. Minimum volatility is proxied by the relevant MSCI Min Volatility net total return index. Quality is proxied by the relevant MSCI Quality net total return index.
Momentum is proxied by the relevant MSCI Momentum net total return index. High Dividend is proxied by the relevant MSCI High Dividend net total return index. Size is proxied by the relevant MSCI Small Cap net total return index. Value is proxied by the relevant MSCI Enhanced Value net total return index. WisdomTree Quality is proxied by the relevant WisdomTree Quality Dividend Growth Index.
The information on mexem.com is for general informational purposes only. It should not be regarded as investment advice. Investing in stocks involves risk. A stock's past performance is not a reliable indicator of its future performance. Always consult a financial advisor or trusted sources before making any investment decisions.
Read the original article on WisdomTree.


-(1)%201%20(4).png)